Using the GameDriver HierarchyPath Debugger
Learn how to use the HierarchyPath Debugger to build and maintain an effective test automation
The HierarchyPath Debugger is an editor plugin that can be utilized to test and debug HierarchyPath queries and trace through their evaluation process, including stepping into or over each step of the node evaluation process, displaying per-node evaluation results, and precise syntax error identification.
Getting Started
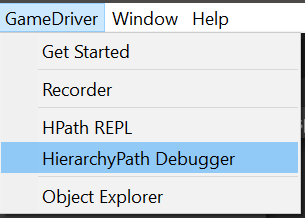
The HierarchyPath Debugger window can be opened in the toolbar by clicking GameDriver > HierarchyPath Debugger, as shown below:

User Interface

HierarchyPath: The HierarchyPath that you wish to evaluate should be placed in this field.
Path Evaluation: This will display the path that is being evaluated, with the currently evaluated node, or node cluster, highlighted.
Run (F5): Pressing 'Run' will evaluate the entire path and display the final results without stopping at any individual node evaluations.
Step Into (F7): Pressing 'Step Into' will move on to the next node to evaluate, or step into the highlighted node cluster.
Step Over (F8): Pressing 'Step Over' functions similarly to Step Into, but will not step inside node clusters and instead only step over to the next node in the current context.
Reset (F12): Pressing 'Reset' will set the debugger back to the very first step of the path evaluation.

Operation: The operation being processed on the current node will be displayed here. This can include node, predicate condition, and comparison operator evaluations.
Node Type: Here you can determine the type of node currently being evaluated, which can include: Axis (a node that represents a relationship or property of another node), Step (the transition into a new node cluster), Predicate (a conditional node), as well as standard types such as Operator, Function, Number, and String.
Stack: All operations currently on the evaluation stack are displayed here, starting from the top of the stack.
Context/Results: All nodes that are being evaluated by the current operation are listed here. Once the path has finished evaluation, the final results will also be displayed here.
The debugger will also resolve a property value when provided a reference via HierarchyPath. As shown below, the resulting value is displayed in the Context/Results panel.
 Note that just like with object evaluation, if multiple properties are resolved by the same HierarchyPath, each of their values will be displayed.
Syntax Error Handling
If the debugger recognizes any syntax errors in the currently inputted HierarchyPath, the offending node will be highlighted in the Path Evaluation display. Hovering your mouse over the red 'x' to the right of the HierarchyPath input field will display a window with information regarding the identity and position of the currently recognized syntax error.

In the above example, the debugger is bringing attention to an unclosed string literal. Note the opening of the string with a single quote at character 27, but the lack of a single quote to close it off at the expected position of character 43, which likewise is highlighted in red in the Path Evaluation display.
